Sunday, September 27, 2015

A Data Cleaning Example

For this particular example,

  • the variables of interest are stored as key:value pairs and
  • a single data cell could contain multiple (unknown) number of key:value pairs.
Basically, we want to convert input dataset on LHS to the output dataset on the RHS as illustrated in the graphic below -


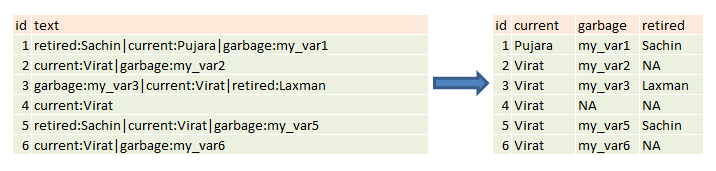
The objective is to separate these key-value pairs and store the values in corresponding key columns.

The hadleyverse packages make this task a fairly simple one, especially tidyr, stringr and magrittr.

Thursday, August 13, 2015

Survival Analysis - 2

In my previous post, I went over basics of survival analysis, that included estimating Kaplan-Meier estimate for a given time-to-event data. In this post, I'm exploring on Cox's proportional hazards model for survival data. KM estimator helps in figuring out whether survival function estimates for different groups are same or different. While survival models like Cox's proportional hazards model help in finding relationship between different covariates to the survival function.

Some basic notes about Cox model -

  • It's a semi-parametric model, as the hazard function (risk per unit time) does not need to be specified.
  • The proportional hazard condition states that the covariates are multiplicatively related to the hazard. (This assumption should always be checked after fitting a Cox model). 
  • In case of categorical covariates, the hazard ratio (e.g. treatment vs no treatment) is constant and does not change over time. One can do away with this assumption by using extended Cox model which allows covariates to be dependent on time.
  • The covariates are constant for each subject and do not vary over time.

(There's one-to-one mapping between hazard function and the survival function i.e. a specific hazard function uniquely determines the survival function and vice versa. Simple mathematical details on this relationship can be found on this wikipedia page.)

I'm using the same datasets (tongue dataset from package KMsurv and a simulated dataset using survsim) and set of packages as used in the previous post - OIsurvdplyrggplot2 and broom .


Sunday, August 2, 2015

Survival Analysis - 1

I recently was looking for methods to apply to time-to-event data and started exploring Survival Analysis Models. In this post, I'm exploring basic KM estimator. It is a nonparametric estimator of the survival function. There are couple of instances when the KM estimator comes in handy -
  • When the survival time is censored
  • Comparing survival function for different preassigned groups.

Below I'm computing KM estimator for a real dataset (on time to death for 80 males who were diagnosed with different types of tongue cancer, from package KMsurv) and a simulated dataset (created using package survsim). In addition I am using survivalOIsurv, dplyr, ggplot2 and broom for this analysis. The first example is taken from an openintro tutorial.

The rmarkdown document illustrating below analysis can also be found here. In my future posts, I'm planning to explore more on following survival models -
  • Proportional hazards model
  • Accelerated failure time Model
  • Multiple events model (More than 2 possible events)
  • Recurring events (Each subject can experience an event multiple times).


Monday, June 8, 2015

ogdindiar: R package to easily access Open Government Data from India Portal

Following up on my earlier posts on accessing Open Government Data from R, I've wrapped this code into an R package - ogdindiar. It's available on GitHub at https://github.com/steadyfish/ogdindiar

It provides one simple function - fetch_data() to download required data resource from the https://data.gov.in portal. You can find the details about the usage in this vignette.

Below is an example that downloads India's annual and seasonal mean temperature data using this package. You can also see it here.

Monday, March 16, 2015

dplyr Use Cases: Non-Interactive Mode

The current release of dplyr (v 0.4.1) offers lot more flexibility regarding usage of important verbs in non-interactive mode. In this post, I'm exploring different possible use-cases.


  • group_by_, select_, rename_:
For group_by_, select_ and rename_, we can pass a character vector of variable names as an argument to .dots parameter.


  • filter_:
To use filter_ function, we need to pass filter criteria as a parameter to .dots. The criteria can be created using lazyeval::interp function.


  • mutate_, transmute_, summarise_:
We need to provide 2 things to these functions - a list of functions to be applied on the input variables (with corresponding input variables) and a character vector of output variables names. These 2 things can be passed to the .dots argument using combination of lazyeval::interp  and setNames function.

  • joins:
For 2 table verbs, there's no *_join_ function and we don't need one for general purposes. We can just pass a named vector to by argument. setNames function comes in handy while doing this.


The R Code for the above mentioned use cases is shown below and can also be found on this GitHub Gist.